Technical Analysis Basics for Forex Traders
In the world of forex trading, making informed decisions is crucial for success. While fundamental analysis examines economic factors, technical analysis focuses on studying historical price data and market statistics to forecast future price movements. This article will introduce you to the fundamental concepts of technical analysis and help you build a solid foundation for making more informed trading decisions.
Table of Contents
What is Technical Analysis?
Technical analysis is a trading methodology that evaluates investments and identifies trading opportunities by analyzing statistical trends gathered from trading activity, such as price movement and volume. Unlike fundamental analysis, which focuses on a currency's intrinsic value based on economic factors, technical analysis concentrates on patterns of price movements, trading signals, and various analytical charting tools.
The core premise of technical analysis rests on three key principles:
- Market action discounts everything: All relevant information, including fundamental factors, market psychology, and external events, is already reflected in the price.
- Prices move in trends: Price movements are not random but tend to follow trends that can be identified and exploited for profit.
- History tends to repeat itself: Market patterns and behaviors recur over time due to consistent market psychology.
"Technical analysis is the study of market action, primarily through the use of charts, for the purpose of forecasting future price trends. The beauty of technical analysis lies in its versatility—it can be applied to any financial market, including forex."
— According to Investopedia
Understanding Price Action
Price action trading is one of the purest forms of technical analysis, focusing solely on the movement of price without using indicators. It's about understanding what the market is doing based on price movements alone.
Price action traders analyze:
- Candlestick patterns: Individual or groups of candlesticks that suggest specific market behavior.
- Price bars: The high, low, open, and close of each price period.
- Trends: The overall direction of market movement over a given time period.
- Swing highs and lows: The peaks and troughs that form as price moves.
One of the biggest advantages of price action trading is its simplicity and clarity. By focusing on price alone, traders can develop a cleaner reading of the market without the confusion that can sometimes come from multiple indicators.
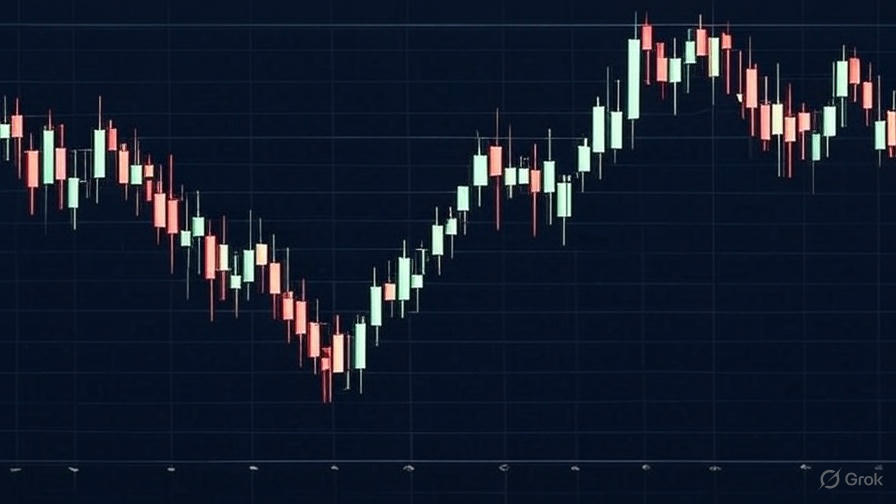
Example of pure price action trading: analyzing candlestick patterns, trends, and swing points without indicators.
Key Chart Patterns
Chart patterns are specific formations that appear on price charts and can help predict future price movements. These patterns typically fall into two categories: continuation patterns and reversal patterns.
Common Reversal Patterns:
- Head and Shoulders: A pattern resembling a baseline with three peaks, where the middle peak (the head) is higher than the two surrounding peaks (the shoulders), indicating a potential trend reversal from bullish to bearish.
- Double Tops and Bottoms: When price reaches the same level twice and fails to break through, often signaling a reversal.
- Triple Tops and Bottoms: Similar to double tops/bottoms but with three peaks or troughs.
- Rounded Bottoms (Saucers): A gradual, curved reversal from a downtrend to an uptrend.
Common Continuation Patterns:
- Flags and Pennants: Short-term consolidation patterns that typically resolve in the direction of the prevailing trend.
- Triangles: Converging trendlines that can signal both continuation (symmetrical) or reversals (ascending/descending).
- Rectangles: Price bouncing between parallel support and resistance levels.
- Cup and Handle: A cup-shaped pattern followed by a small consolidation (the handle), typically a bullish continuation pattern.
Journal Your Chart Pattern Successes
Track which chart patterns yield the best results for your trading style using FXolio's custom tagging and advanced analytics.
Start Your Technical Analysis JournalSupport and Resistance Levels
Support and resistance are fundamental concepts in technical analysis, representing price levels where a currency pair has historically had difficulty moving beyond.
Support: A price level where a downtrend can be expected to pause due to increased demand (buying interest). As the price falls toward support and gets cheaper, buyers see a better deal and are more likely to buy.
Resistance: A price level where an uptrend can be expected to pause due to increased supply (selling interest). As the price rises toward resistance, sellers are more likely to sell to take profits.
Support and resistance levels can be identified using:
- Previous highs and lows: Areas where price has reversed in the past.
- Trendlines: Diagonal lines connecting a series of higher lows (uptrend) or lower highs (downtrend).
- Moving averages: Dynamic support/resistance levels that move with price over time.
- Fibonacci retracement levels: Percentage-based retracement levels calculated from significant price moves.
- Round numbers: Psychological levels ending in "00" or "50" that often act as support/resistance.
A key principle to understand is that when a support level is broken, it often becomes a new resistance level; similarly, when resistance is broken, it frequently becomes new support. This "role reversal" concept is essential for technical traders to master.
Essential Technical Indicators
Technical indicators are mathematical calculations based on price, volume, or open interest that provide insight into market conditions. These tools can help identify trends, measure momentum, and signal potential entry and exit points.
Trend Indicators:
- Moving Averages: Calculate the average price over a specified period, smoothing out price data to identify trends. Common types include Simple Moving Averages (SMA) and Exponential Moving Averages (EMA).
- Moving Average Convergence Divergence (MACD): Shows the relationship between two moving averages, helping identify trend direction and momentum.
- Average Directional Index (ADX): Measures the strength of a trend regardless of its direction.
Momentum Indicators:
- Relative Strength Index (RSI): Measures the speed and change of price movements on a scale from 0 to 100, identifying overbought or oversold conditions.
- Stochastic Oscillator: Compares a closing price to its price range over a specific period, also used to identify overbought/oversold conditions.
- Commodity Channel Index (CCI): Identifies cyclical turns in price and can signal overbought or oversold conditions.
Volatility Indicators:
- Bollinger Bands: Consist of a middle band (usually a 20-period SMA) and two standard deviation bands above and below it, helping identify volatility and potential reversal points.
- Average True Range (ATR): Measures market volatility by decomposing the entire range of a currency pair for that period.
- Keltner Channels: Similar to Bollinger Bands but use ATR instead of standard deviation to set the channel width.
It's important to note that no indicator is perfect. Each has strengths and weaknesses, and they often work best when used in combination with other technical analysis tools.
"Trading indicators are best used to confirm what you see happening on the price chart, not as a replacement for analyzing price action. The most effective traders use indicators as a supplementary tool, not as their primary decision maker."
— From BabyPips Trading Academy
Combining Technical Analysis Methods
While each technical analysis method has its merits, the most successful traders typically combine multiple approaches to get a more comprehensive view of the market. This multi-faceted approach can help confirm signals and reduce false positives.
Effective ways to combine technical analysis tools include:
- Confluence points: Look for situations where multiple technical factors align, such as a chart pattern completing at a key support/resistance level while momentum indicators show divergence.
- Multi-timeframe analysis: Analyze the same currency pair across different timeframes to get both the big picture trend and more precise entry/exit points.
- Price action with indicators: Use indicators to confirm what price action is suggesting, not the other way around.
- Trend and momentum: Identify the trend with one set of tools and measure its strength with another.
A well-structured approach might look like:
- Identify the overall trend using higher timeframe charts and trend indicators
- Look for key support/resistance levels and chart patterns
- Confirm potential trade setups with momentum indicators
- Fine-tune entry and exit points using price action on lower timeframes
Master Multiple Analysis Techniques
FXolio's sophisticated journaling features allow you to track which combination of technical analysis methods works best for your personal trading style.
Optimize Your Analysis ApproachCommon Technical Analysis Mistakes
Even experienced traders sometimes fall victim to these common technical analysis pitfalls:
- Indicator overload: Using too many indicators that essentially measure the same thing, leading to confusion and paralysis by analysis.
- Ignoring the broader trend: Focusing too much on short-term signals while ignoring the direction of the larger trend.
- Cherry-picking patterns: Seeing chart patterns that aren't really there because you're looking for confirmation of your existing bias.
- Treating indicators as crystal balls: Expecting technical indicators to predict the future with certainty instead of understanding them as probability tools.
- Neglecting fundamental factors: Relying solely on technical analysis without considering major fundamental events that can override technical signals.
- Moving support/resistance levels to fit your narrative: Adjusting your analysis to support your position rather than objectively interpreting the charts.
To avoid these mistakes, maintain objectivity, backtest your strategies, and always use risk management principles regardless of how strong a technical signal appears to be.
Tracking Your Technical Analysis
One of the most powerful ways to improve your technical analysis skills is to maintain a detailed trading journal. By consistently recording your analysis, decisions, and outcomes, you can identify patterns in your trading and refine your approach over time.
When journaling your technical analysis, be sure to record:
- The specific technical signals that triggered your entry: Include screenshots of charts with your analysis marked.
- Your interpretation of these signals: What did you think they were indicating about future price movement?
- Confluence factors: What other technical elements supported your analysis?
- The timeframes you analyzed: Did you check multiple timeframes for confirmation?
- Any contradicting signals you chose to overlook: Were there warning signs you dismissed?
- The outcome: How did the market actually behave compared to your analysis?
Over time, this detailed record will reveal which technical approaches work best for your trading style and the specific currency pairs you trade most often. This personalized insight is invaluable and impossible to gain without systematic tracking.
Frequently Asked Questions
Which technical indicators are best for beginners?
Beginners should start with simple, easy-to-understand indicators like moving averages (to identify trends), RSI (to spot overbought/oversold conditions), and MACD (to gauge momentum). These provide a solid foundation before moving on to more complex indicators. Remember that understanding what an indicator shows is more important than using many indicators.
Is technical analysis reliable for forex trading?
Technical analysis can be reliable when used properly, but it's not infallible. It works because many traders use similar techniques, creating self-fulfilling prophecies at key levels. Its reliability increases when you combine multiple technical approaches, use appropriate timeframes for your trading style, and account for fundamental factors that might override technical signals.
What's the difference between technical and fundamental analysis?
Technical analysis studies price action and statistics to forecast future movements, focusing on charts and historical data. Fundamental analysis evaluates economic, financial, and other qualitative/quantitative factors that affect a currency's value. Technical analysis answers "what" is happening in the market, while fundamental analysis explains "why." Many successful traders use both approaches for a more complete market perspective.
How do I know which timeframe to use for technical analysis?
The appropriate timeframe depends on your trading style and goals. Day traders might focus on 5-minute to 1-hour charts, swing traders on 4-hour to daily charts, and position traders on daily to weekly charts. A good practice is to analyze at least three timeframes: a higher one for trend direction, a middle one for entry signals, and a lower one for precise entry/exit timing. Your trading journal can help you identify which timeframes work best for your particular strategy.